Analyze: Tm Profile
|
![]()
Analyze: Tm Profile
|
![]()
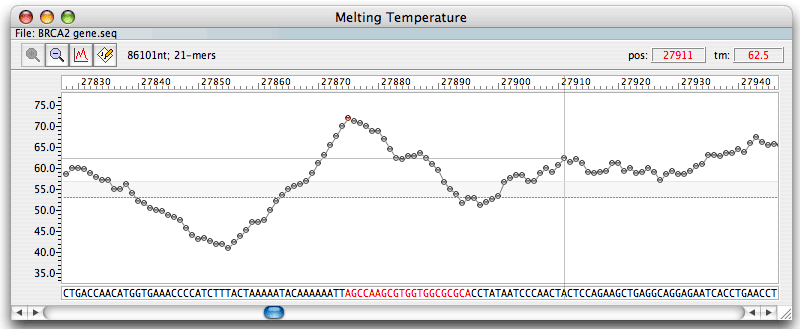
The Melting Temperature window displays a segment of the active DNA/RNA sequence file and a Tm plot of the oligonucleotides with a default length of 21 nt within the segment. The length of the segment displayed depends upon the monitor resolution. Each dot (or bar - user preference) on the Tm graph represents the melting temperature of a 21-mer oligonucleotide. The selected by clicking on the graph oligo, displayed in red, is called the Current Oligo - readily available for analysis. The cursor position, marked by a vertical line, is shown in red at the top right. To view a Tm plot of the entire file, you would need to select the "zoom" feature at the top of the Melting Temperature graph. The Sequence window also displays this but in a tiny format. The presentation of data displayed in the "Melting Temperature" window can be modified with the "Graph" and "Options" submenus next to "Zoom." This window may also display free energy (dG), GC% or degeneracy graph. The Sequence window displays the same kind of graph as shown on this window at any given time, and in the example above it is the melting temperature calculated without the dangling ends (default), abbreviated as "tm".
The horizontal dotted line bisecting the Tm plot represents the average Tm (or free energy or degeneracy or %GC) of all the 21-mer oligonucleotides in the sequence file. Below the Tm plot is the nucleotide sequence (both strands) in upper case letters. Corresponding amino acids appear in color below (color indicates the codon usage).